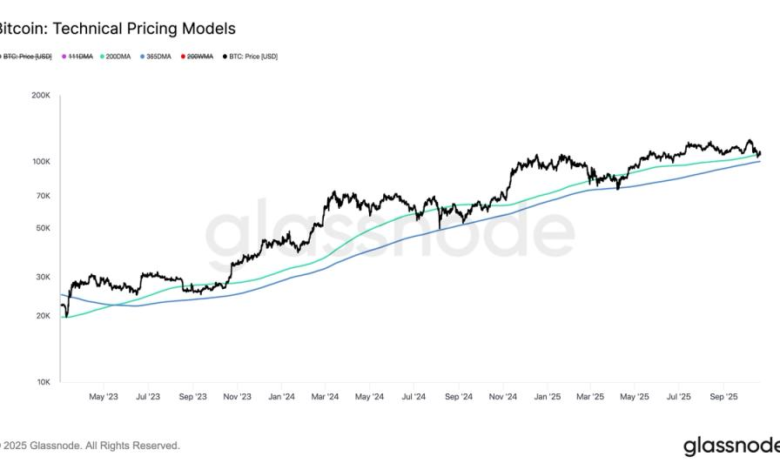
Bitcoin continues to struggle during one of its strongest months, often referred to as “Uptober,” currently down more than 5% and trading below $108,000, as it approaches several critical support and resistance levels.
The 200-day simple moving average (200sma), a key indicator that often separates bull and bear markets, now sits at $107,846 and acts as immediate resistance.
Since the beginning of the 2023 cycle, Bitcoin has mostly held this level as support, but it has slipped below it in the rains of 2023 and 2024 and again in April 2025. This is the fourth time in this cycle that the price of Bitcoin has been sandwiched between these two averages, a setup range that can last for months.
Additional key levels include $103,509, the average cost base of 2025 investors according to checkonchain data. This serves as an important price floor, as well as the $100,000 psychological support level with market sentiment.

In reverse, $ 112,100 represents short-term cost basiswhich reflects the average onchain acquisition price for coins transferred within the previous six months.
Historically, Bitcoin has dipped below this level during corrections, but prolonged trading above it usually indicates the continuation of a bull market.