Effective Crypto Trading Strategies Unveiled

Are you tired of complex and confusing trading strategies that yield inconsistent results in the crypto market? What if there was a simple yet powerful approach that could help you identify high-potential entry points and maximize your profits? In this section, we will unveil an effective trading strategy that combines trend and momentum indicators to guide your crypto trading decisions.
By utilizing Exponential Moving Averages (EMAs) and the Average Directional Index (ADX), this strategy helps you confirm trend strength and provides clear entry signals for both long and short trades. Say goodbye to guesswork and hello to a disciplined approach that can unlock the potential of your crypto portfolio.
Key Takeaways:
- Efficient and successful crypto trading strategies don’t need to be complex
- Combining trend and momentum indicators can help identify high-potential entry points
- Exponential Moving Averages (EMAs) and the Average Directional Index (ADX) are effective tools for confirming trend strength
- This strategy provides clear entry signals for both long and short trades
- Implementing these crypto trading strategies can help maximize your potential for market gains
Basics of the EMA and ADX Strategy
The core of this trading strategy centers around the effective combination of Exponential Moving Averages (EMAs) and the Average Directional Index (ADX). These indicators work in harmony to identify and validate trends in the cryptocurrency market, empowering traders with valuable insights for identifying lucrative entry points.
It is crucial for traders to focus on key indicators such as EMA 25, EMA 100, and EMA 200, along with the ADX 14, to accurately determine trend strength and establish reliable entry signals. By understanding the fundamental concepts behind these indicators and comprehending their interaction, traders can effectively implement this strategy in their trading activities.
The Exponential Moving Averages provide a smoothed representation of price trends by placing more weight on recent data points. This feature allows traders to assess market movement trends more effectively, reducing noise and enhancing recognition of significant price changes. By calculating averages based on predetermined periods, such as 25, 100, and 200, traders can identify the overall direction and strength of a trend.
On the other hand, the Average Directional Index measures trend strength by analyzing the magnitude of price movements. An ADX reading above 30 indicates a strong trend, while a reading below 30 suggests a weak or non-existent trend. Traders should pay close attention to the ADX as it confirms the validity of a trend identified by the EMAs, giving them added confidence in their trading decisions.
By familiarizing themselves with the basics of Exponential Moving Averages and the Average Directional Index, traders can implement this strategy with precision. This approach enables them to accurately identify and validate trend direction, empowering them to make informed decisions on when to enter or exit trades.
Now that we understand the foundation of the EMA and ADX strategy, let’s dive deeper into the specific entry and exit signals for effective implementation in Section 3.
Entry and Exit Signals for the EMA and ADX Strategy
Executing the EMA and ADX strategy successfully requires a clear understanding of the entry and exit signals that guide trading decisions. These signals play a crucial role in determining when to enter and exit trades, helping traders maximize their potential for profits.
For long trades, the entry signal involves several key factors:
- The price should be above EMA200, indicating an upward trend in the market.
- EMA25 and EMA100 should be positioned above EMA200, further confirming the strength of the uptrend.
- The ADX should be above 30, indicating a robust market trend.
A long entry signal is triggered when there is a temporary dip below EMA25, followed by a cross back above within five candles. This indicates a potential buying opportunity as the price is expected to continue its upward movement.
Conversely, for short trades, the indicators are reversed:
- The price should be below EMA200, suggesting a downtrend in the market.
- EMA25 should be positioned below EMA100, reinforcing the downward momentum.
Regarding exit signals, traders have two primary options:
- Setting fixed stop-loss and take-profit levels based on personal risk tolerance and profit targets.
- Using EMA25 as a dynamic guide for exit points. When the price crosses below EMA25, it may be an indication to exit the trade.
By comprehending and utilizing these signals, traders can effectively enter and exit trades in a disciplined and strategic manner, reducing the likelihood of emotional or impulsive trading decisions.
Note: It is essential to consider other factors and perform thorough analysis before executing trades based solely on these signals. Risk management and thorough analysis are crucial components of successful trading strategies.

John Doe, Experienced Crypto Trader:
Understanding the entry and exit signals provided by the EMA and ADX strategy has greatly improved my trading outcomes. By following these signals and combining them with my analysis, I have been able to enter trades at opportune moments and exit with profitable results. It’s crucial to remain disciplined and stick to the signals rather than letting emotions dictate your trading decisions.
Chart Timeframes and Backtest Results
The EMA and ADX strategy can be applied to various chart timeframes, including 15M, 1H, 4H, and daily charts. Analyzing different timeframes allows traders to gain a comprehensive understanding of market trends and identify potential entry points across various trading horizons.
However, based on extensive backtest results, the EMA and ADX strategy has consistently produced the best trading outcomes on hourly and daily charts. These timeframes provide a balanced perspective between short-term fluctuations and long-term trends, enabling traders to make informed decisions with a higher probability of success.
Backtesting, a method of simulating trades using historical data, has demonstrated the efficiency and profitability of this strategy. The success rates obtained from backtesting have consistently ranged from 80% to an impressive 90% under different market conditions and with a variety of selected cryptocurrencies. These results underscore the robustness of the EMA and ADX strategy in generating successful trading outcomes.
By focusing on the recommended chart timeframes and leveraging the power of backtesting, traders can significantly enhance their chances of achieving profitable outcomes. The combination of thorough analysis and historical performance allows traders to assess the reliability and effectiveness of the strategy, making it a valuable tool for crypto trading success.

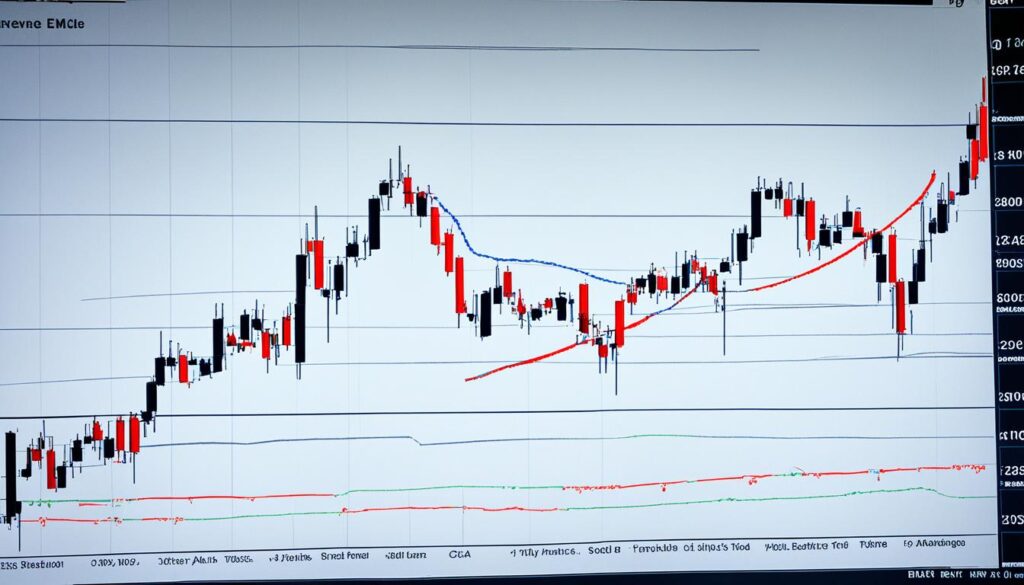
Image: Backtest results showcasing the success of the EMA and ADX strategy.
Next, we will explore the specific signals that guide traders in executing the EMA and ADX strategy, ensuring precise entry and exit points for maximizing potential gains.
Conclusion
In conclusion, mastering effective crypto trading strategies is essential for maximizing profits and achieving trading success in the cryptocurrency market. The EMA and ADX strategy provides a straightforward yet powerful approach to identifying high-potential entry points and managing trades in a disciplined manner. By understanding the basics of this strategy, including the use of EMAs and the ADX, traders can navigate the crypto market with confidence and enhance their trading outcomes.
Implementing these strategies, traders can unlock the potential of their portfolios and elevate their crypto trading skills. By following expert advice and continuously honing their knowledge of various crypto trading strategies, traders can stay ahead of market trends and make informed decisions that maximize their profits. It’s important to remember that success in crypto trading doesn’t come overnight, but with perseverance and a well-crafted trading plan, traders can achieve their desired financial goals.
As the crypto market continues to evolve and present new opportunities, traders must remain adaptable and continuously educate themselves on the latest industry trends. By staying informed and implementing proven crypto trading strategies, traders can increase their chances of success and unlock the full potential of the crypto market.
FAQ
What is the EMA and ADX strategy?
The EMA and ADX strategy is a trading strategy that combines Exponential Moving Averages (EMAs) and the Average Directional Index (ADX) to identify trends and entry points in the crypto market.
How do EMAs and the ADX indicator work together?
EMAs and the ADX indicator work together to confirm trend strength and provide clear entry signals. Key indicators such as EMA 25, EMA 100, EMA 200, and ADX 14 are used to identify and validate trend strength.
What are the entry and exit signals for this strategy?
For long trades, the entry signal requires the price to be above EMA200, with EMA25 and EMA100 above EMA200, and the ADX above 30. A dip below EMA25 followed by a cross back above within five candles signals the entry point. For short trades, the indicators are reversed. Exit signals can be determined by fixed Stop-Loss/Take-Profit levels or using the EMA25 as a guide.
Which chart timeframes can I use for this strategy?
The EMA and ADX strategy can be applied to various chart timeframes, including 15M, 1H, 4H, and daily charts. However, backtest results show that the strategy yields the best results on hourly and daily charts.
How successful is the EMA and ADX strategy?
Backtests have shown that the EMA and ADX strategy has a success rate of 80% to 90% under different market conditions and chosen tokens.
Source Links
- https://medium.com/@bencryptoknowledge/unveiling-the-most-powerful-and-easiest-crypto-trading-strategy-to-implement-immediately-673d94459598
- https://www.linkedin.com/pulse/bitcoin-trading-strategies-quantifiedstrategies-0sgwe
- https://www.linkedin.com/posts/startup-info_effective-crypto-trading-strategies-unveiled-activity-7164344371268468736-C2CT


