The cryptocurrency market faces mounting pressure as global economic tensions escalate, with Uniswap (UNI) experiencing dramatic price swings reflecting broader market uncertainty.
UNI’s recent 10.9% price range demonstrates how geopolitical factors are directly influencing digital asset valuations, as traders navigate between risk-off sentiment and opportunistic positioning.
Despite challenging conditions, Uniswap has shown resilience by breaking above key resistance levels, suggesting potential stabilization after significant volatility.
Technical Analysis Highlights
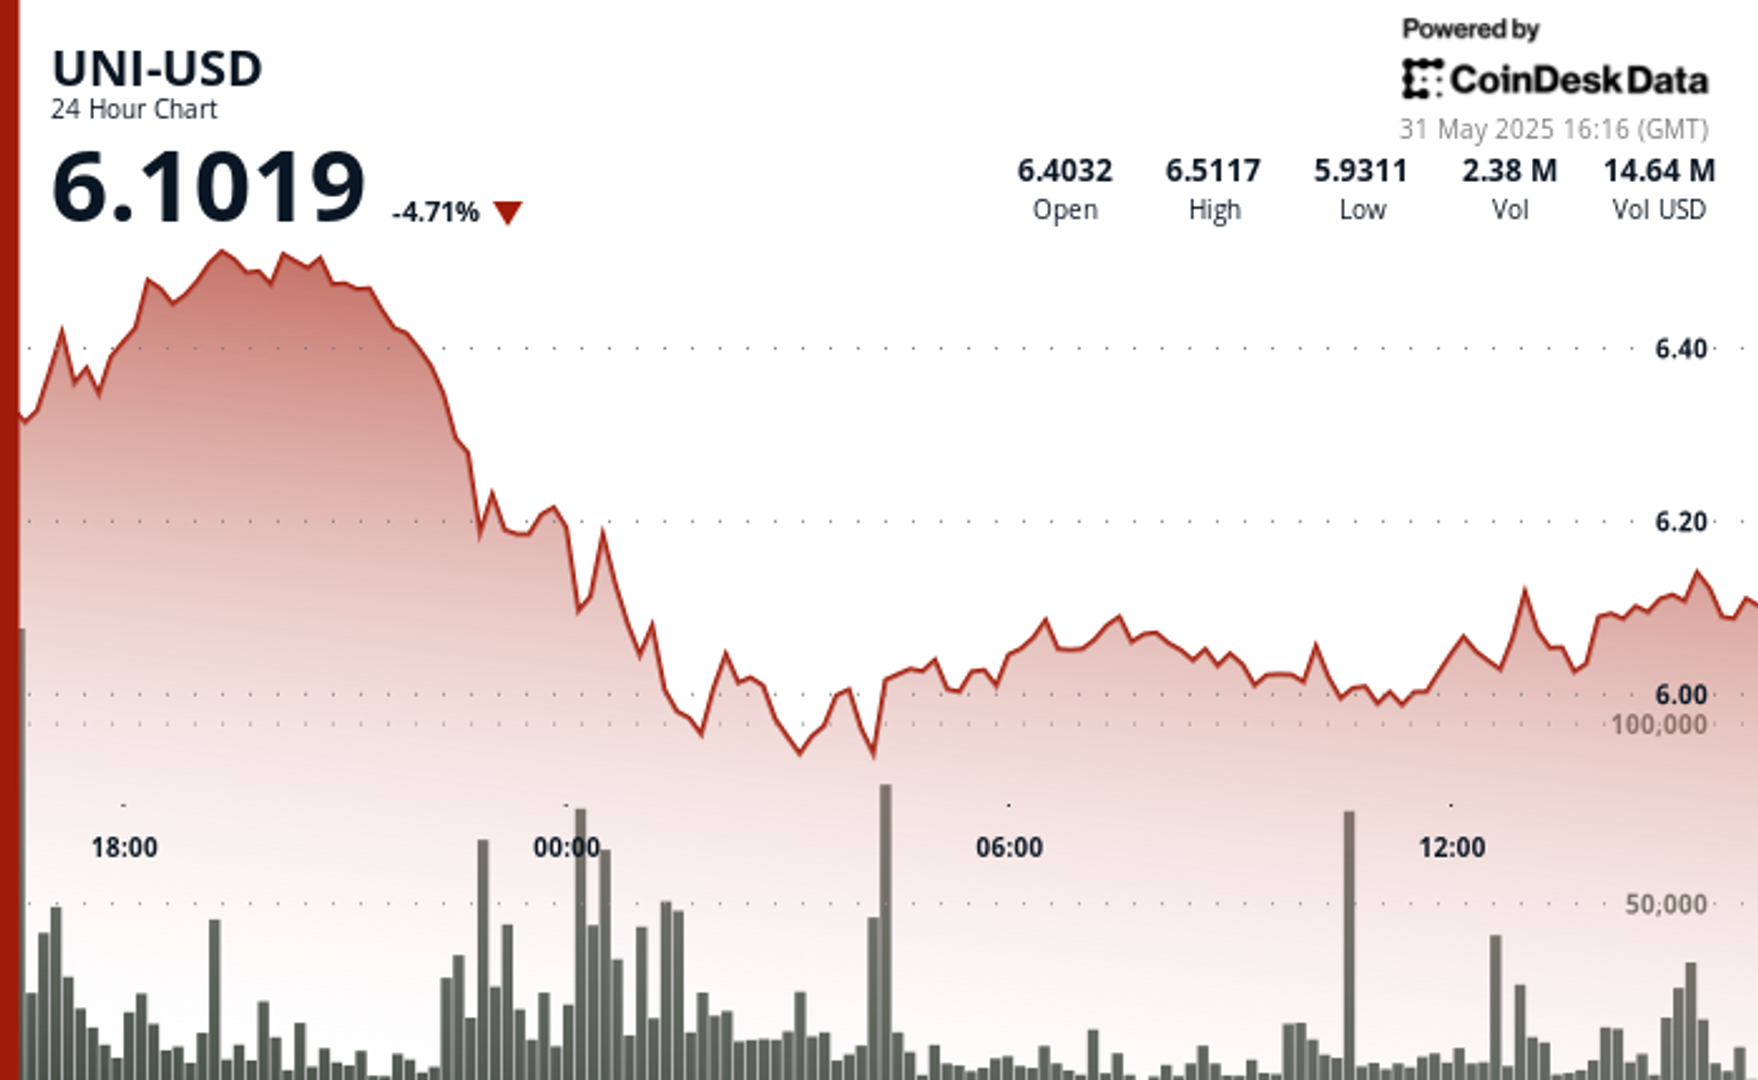
- UNI experienced significant price turbulence over the 24-hour period, with a substantial range of 0.644 (10.9%) from the high of 6.589 to the low of 5.945, according to CoinDesk Research’s technical analysis data model.
- The token faced a sharp selloff during the 16:00-01:00 period, plummeting from 6.510 to 5.954, with notably high volume (4.4M) at the 01:00 low, establishing a strong volume support zone.
- A modest recovery followed, with UNI finding resistance around 6.120 and consolidating between 6.000-6.050, suggesting market indecision after the significant correction.
- In the last hour, UNI experienced a significant downward trend followed by a modest recovery.
- The token declined from 6.110 to a low of 6.017 around 13:51, establishing a key support zone with increased volume.
- A notable reversal occurred at 14:01 when UNI surged 3.6% from 6.032 to 6.054, accompanied by elevated volume (28.7K), suggesting renewed buying interest.
- The price action formed a bullish channel with resistance at 6.055 and support at 6.030, with the closing price of 6.051 indicating potential short-term stabilization after the earlier volatility.
External References