By Omkar Godbole (All times ET unless indicated otherwise)
The crypto market has stabilized somewhat following comments from Commerce Minister Howard Lutnick, who said President Donald Trump could announce on Wednesday a pathway for tariff relief on Canadian and Mexican imports covered by NAFTA.
That has helped BTC bounce to nearly $90K, with the total crypto market cap rising to the $2.9 trillion mark. The recovery could extend further as the recent trade war fears and market volatility have reignited bets on Federal Reserve (Fed) rate cuts.
According to CME’s FedWatch tool, the market is now pricing in at least three rate cuts for this year, while the 10-year Treasury yield has retreated to 4.15%, down from 4.80% at the time of Trump’s inauguration. Meanwhile, Germany’s decision to abandon its fiscal constraints has led to soaring bond yields, prompting a sell-off in the dollar index that could encourage risk-taking in the market.
As a result, there is a chance that bitcoin may revisit its weekend high of $95,000, particularly as technical charts indicate signs of seller exhaustion.
However, worsening growth concerns could limit these gains. Just two days ago, the Atlanta Fed’s GDP forecast turned negative at -2.8%, raising fears of stagflation, as noted by Singapore-based QCP Capital. The firm stressed the importance of monitoring corporate yield spreads—both high-yield and investment-grade bonds—in relation to U.S. Treasury yields for signs of market stress. “While this isn’t signaling panic right now, it’s a trend worth monitoring closely,” QCP said in a Telegram broadcast.
An important consideration is how much of the decline in the 10-year yield and the weakness in the dollar can be attributed to traders adjusting their expectations about U.S. economic exceptionalism, which was largely based on Biden era’s fiscal splurge. Given the rise of ETFs and Trump’s pro-crypto stance, bitcoin has become more of a U.S. play, and a shift in the U.S. exceptionalism narrative could lead to BTC volatility.
JPMorgan, however, foresees strengthening of the U.S. exceptionalism narrative under Trump’s Presidency.
All of this means that Wednesday’s U.S. ISM non-manufacturing (services) PMI and Friday’s nonfarm payrolls could significantly influence the crypto markets.
There are also rumors that President Trump will unveil the crypto reserve strategy at the White House Crypto Summit this Friday. With Trump having made considerable promises, the markets will be watching closely to see if he delivers; otherwise, there could be further turmoil ahead. Stay alert!
What to Watch
- Crypto:
- March 5, 11:00 a.m.: Circle hosts a live webinar titled “State of the USDC Economy 2025” featuring Circle Chief Strategy Officer and Head of Global Policy Dante Disparte and three other executives from Bridge, Nubank and Cumberland.
- March 6: Ethereum-based L2 blockchain MegaETH deploys its public testnet, with user onboarding starting on March 10.
- March 7: President Trump will host the inaugural White House Crypto Summit, bringing together top cryptocurrency founders, CEOs and investors.
- March 11: The Bitcoin Policy Institute and U.S. Senator Cynthia Lummis co-host the invitation-only one-day event “Bitcoin for America” in Washington.
- March 12: Hemi, an L2 blockchain that operates on both Bitcoin and Ethereum, has its mainnet launch.
- Macro
- March 5, 8:00 a.m.: S&P Global releases February Brazil economic activity data.
- Services PMI Prev. 47.6
- Composite PMI Prev. 48.2
- March 5, 8:15 a.m.: Automatic Data Processing (ADP) releases February U.S. non-farm private sector employment data.
- ADP Employment Change Est. 140K vs. Prev. 183K
- March 5, 9:30 a.m.: S&P Global releases February Canada economic activity data.
- Services PMI Prev. 49
- Composite PMI Prev. 49.5
- March 5, 9:45 a.m.: S&P Global releases February U.S. economic activity data.
- Services PMI Est. 49.7 vs. Prev. 52.9
- Composite PMI Est. vs. 50.4 vs. Prev. 52.7
- March 5, 10:00 a.m.: Institute for Supply Management (ISM) releases February U.S. economic activity data.
- Services PMI Est. 52.6 vs. Prev. 52.8
- March 5, 8:00 a.m.: S&P Global releases February Brazil economic activity data.
- Earnings (Ests. based on FactSet data)
Token Events
- Governance votes & calls
- Unlocks
- March 7: Kaspa (KAS) to unlock 0.63% of circulating supply worth $12.68 million.
- March 9: Movement (MOVE) to unlock 2.08% of its circulating supply worth $20.85 million.
- March 12: Aptos (APT) to unlock 1.93% of circulating supply worth $67.41 million.
- March 15: Starknet (STRK) to unlock 2.33% of its circulating supply worth $11.88 million.
- March 15: Sei (SEI) to unlock 1.19% of its circulating supply worth $12.76 million.
- March 16: Arbitrum (ARB) to unlock 2.1% of its circulating supply worth $37.03 million.
- Token Listings
- March 5: Just (JST) to be listed on HashKey
- March 6: Roam (ROAM) to be listed on KuCoin and MEXC.
Conferences
Token Talk
By Shaurya Malwa
- Berachain’s ‘first’ memecoin HENLO goes live, racking up a $26 million market cap shortly after issuance.
- HENLO is a community-driven memecoin on Berachain, created by The Honey Jar collective, focusing on humor and engagement with no explicit utility.
- It raised $3 million in a February 2025 seed round, backed by Framework Ventures and other VCs.
- It offers staking, DEX trading, and yield farming on Berachain’s mainnet, with Henlo ‘points’ to reward early adopters.
- Aims to enhance utility with staking and governance, expand partnerships, refine tokenomics (with a 100 billion total supply), and grow its community through events and airdrops.
Derivatives Positioning
- Positioning in BTC and ETH CME futures remains light despite signs of market stability, leaving the basis near 6%.
- BTC, ETH perpetual funding rates are marginally positive, indicating continued caution among traders.
- BCH leads the majors in terms of price and open interest gains, but the flat 24-hour cumulative volume delta questions the sustainability of the price surge.
- BTC risk reversals show a bias for puts in mid-March and end-of-the-month expiries. The pricing flips decisively bullish in favor of calls only after the April expiry. ETH options show a similar story.
Market Movements:
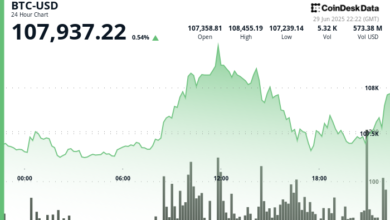
- BTC is up 2.85% from 4 p.m. ET Tuesday at $90,063.44 (24hrs: +6.98%)
- ETH is up 2.82% at $2,240.32 (24hrs: +6.11%)
- CoinDesk 20 is down 4.37% at 2,938.93 (24hrs: +7.8%)
- Ether CESR Composite Staking Rate is up 29 bps at 3.36%
- BTC funding rate is at -0.0007% (-0.25% annualized) on Binance

- DXY is down 0.69% at 105.01
- Gold is up 0.57% at $2926.20/oz
- Silver is up 2.58% at $32.94/oz
- Nikkei 225 closed +0.23% at 37,418.24
- Hang Seng closed +2.84% at 23,594.21
- FTSE is up 0.6% at 8,811.13
- Euro Stoxx 50 is up 2.45% at 5,519.47
- DJIA closed on Tuesday -1.55% at 42,520.99
- S&P 500 closed -1.22% at 5,778.15
- Nasdaq closed -0.35% at 18,285.16
- S&P/TSX Composite Index closed -1.72% at 24,572.00
- S&P 40 Latin America closed unchanged at 2,286.69
- U.S. 10-year Treasury rate is unchanged at 4.25%
- E-mini S&P 500 futures are up 0.66% at 5,828.00
- E-mini Nasdaq-100 futures are up 0.81% at 20,564.00
- E-mini Dow Jones Industrial Average Index futures are up 0.58% at 42,840.00
Bitcoin Stats:
- BTC Dominance: 61.29 (0.03%)
- Ethereum to bitcoin ratio: 0.02500 (0.48%)
- Hashrate (seven-day moving average): 808 EH/s
- Hashprice (spot): $49.6
- Total Fees: 5.24 BTC / $444,853
- CME Futures Open Interest: 139,245 BTC
- BTC priced in gold: 30.7 oz
- BTC vs gold market cap: 8.72%
Technical Analysis

- The dollar index, which tracks the greenback’s value against major currencies, has dropped to the lowest since November, establishing a proper downtrend on the daily chart.
- With the German-U.S.- bond yield spread widening in the EUR-positive manner, further losses in the DXY can be expected.
- Weakness in the DXY generally bodes well for riskier assets.
Crypto Equities
- MicroStrategy (MSTR): closed on Tuesday at $275.15 (+9.66%), up 3.83% at $285.80 in pre-market
- Coinbase Global (COIN): closed at $212.55 (+3.3%), up 2.34% at $217.53
- Galaxy Digital Holdings (GLXY): closed at C$19.04 (-8.29%)
- MARA Holdings (MARA): closed at $13.97 (+1.31%), up 4.58% at $14.61
- Riot Platforms (RIOT): closed at $8.41(-5.08%), up 4.28% at $8.77
- Core Scientific (CORZ): closed at $9.59 (-5.42%), up 5.74% at $10.14
- CleanSpark (CLSK): closed at $7.76 (-0.39%), up 4.64% at $8.12
- CoinShares Valkyrie Bitcoin Miners ETF (WGMI): closed at $16.26 (-1.45%), up 5.1% at $17.09
- Semler Scientific (SMLR): closed at $38.36 (-1.36%), up 4.14% at $39.95
- Exodus Movement (EXOD): closed +3.69% at $42.48
ETF Flows
Spot BTC ETFs:
- Daily net flow: -$143.5 million
- Cumulative net flows: $36.73 billion
- Total BTC holdings ~ 1,139 million.
Spot ETH ETFs
- Daily net flow: $14.6 million
- Cumulative net flows: $2.82 billion
- Total ETH holdings ~ 3.649 million.
Source: Farside Investors
Overnight Flows

Chart of the Day

- The chart shows bitcoin’s options-based implied volatility term structure, a graphical representation of implied or expected volatilities at different expirations.
- Both forward IV and mark IV show a big bump higher on March 8, a sign that traders expect Trump’s comments at Friday’s White House Crypto summit to lead to volatile market conditions.
While You Were Sleeping
- Metaplanet Buys 497 BTC in Another Bargain-Hunting Bitcoin Acquisition (CoinDesk): Japan’s Metaplanet announced Wednesday that its latest bitcoin purchase, acquired at $88,448 per BTC, brings its total holdings to 2,888 BTC.
- BlackRock’s Bitcoin ETF Registers Highest Trading Volume in 3 Months (CoinDesk): As BlackRock’s spot Bitcoin ETF (IBIT) price declined last week, trading volume hit its highest level since mid-November, according to TradingView data.
- AAVE Jumps 21% as Aave DAO Reveals its ‘Most Important’ Proposal (CoinDesk): On Tuesday, Aave DAO proposed a plan to boost AAVE token value and reward users, including increased staking benefits, a buyback program, and protections against market downturns.
- Key Moments From Donald Trump’s Address to Congress (Financial Times): In a Tuesday night address to Congress, Trump pledged to bring Greenland into the U.S., called for ending the Russia-Ukraine war, and praised Elon Musk’s push to cut government waste.
- China Targets ‘Around 5%’ Growth in 2025 and Lays Out Stimulus Measures As Trade Worries Mount (CNBC): At its annual legislative meeting, China set a 2025 budget deficit target of 4% of GDP and lowered its consumer inflation target to around 2%.
- Dollar Falls on Fears Over U.S. Outlook (The Wall Street Journal): The dollar slid to a 16-week low, with the DXY index at 105.252, as concerns over U.S. economic weakness, trade policy turmoil, and inflation weighed on investor confidence, Pepperstone’s Michael Brown said.
In the Ether